View and evaluate applications
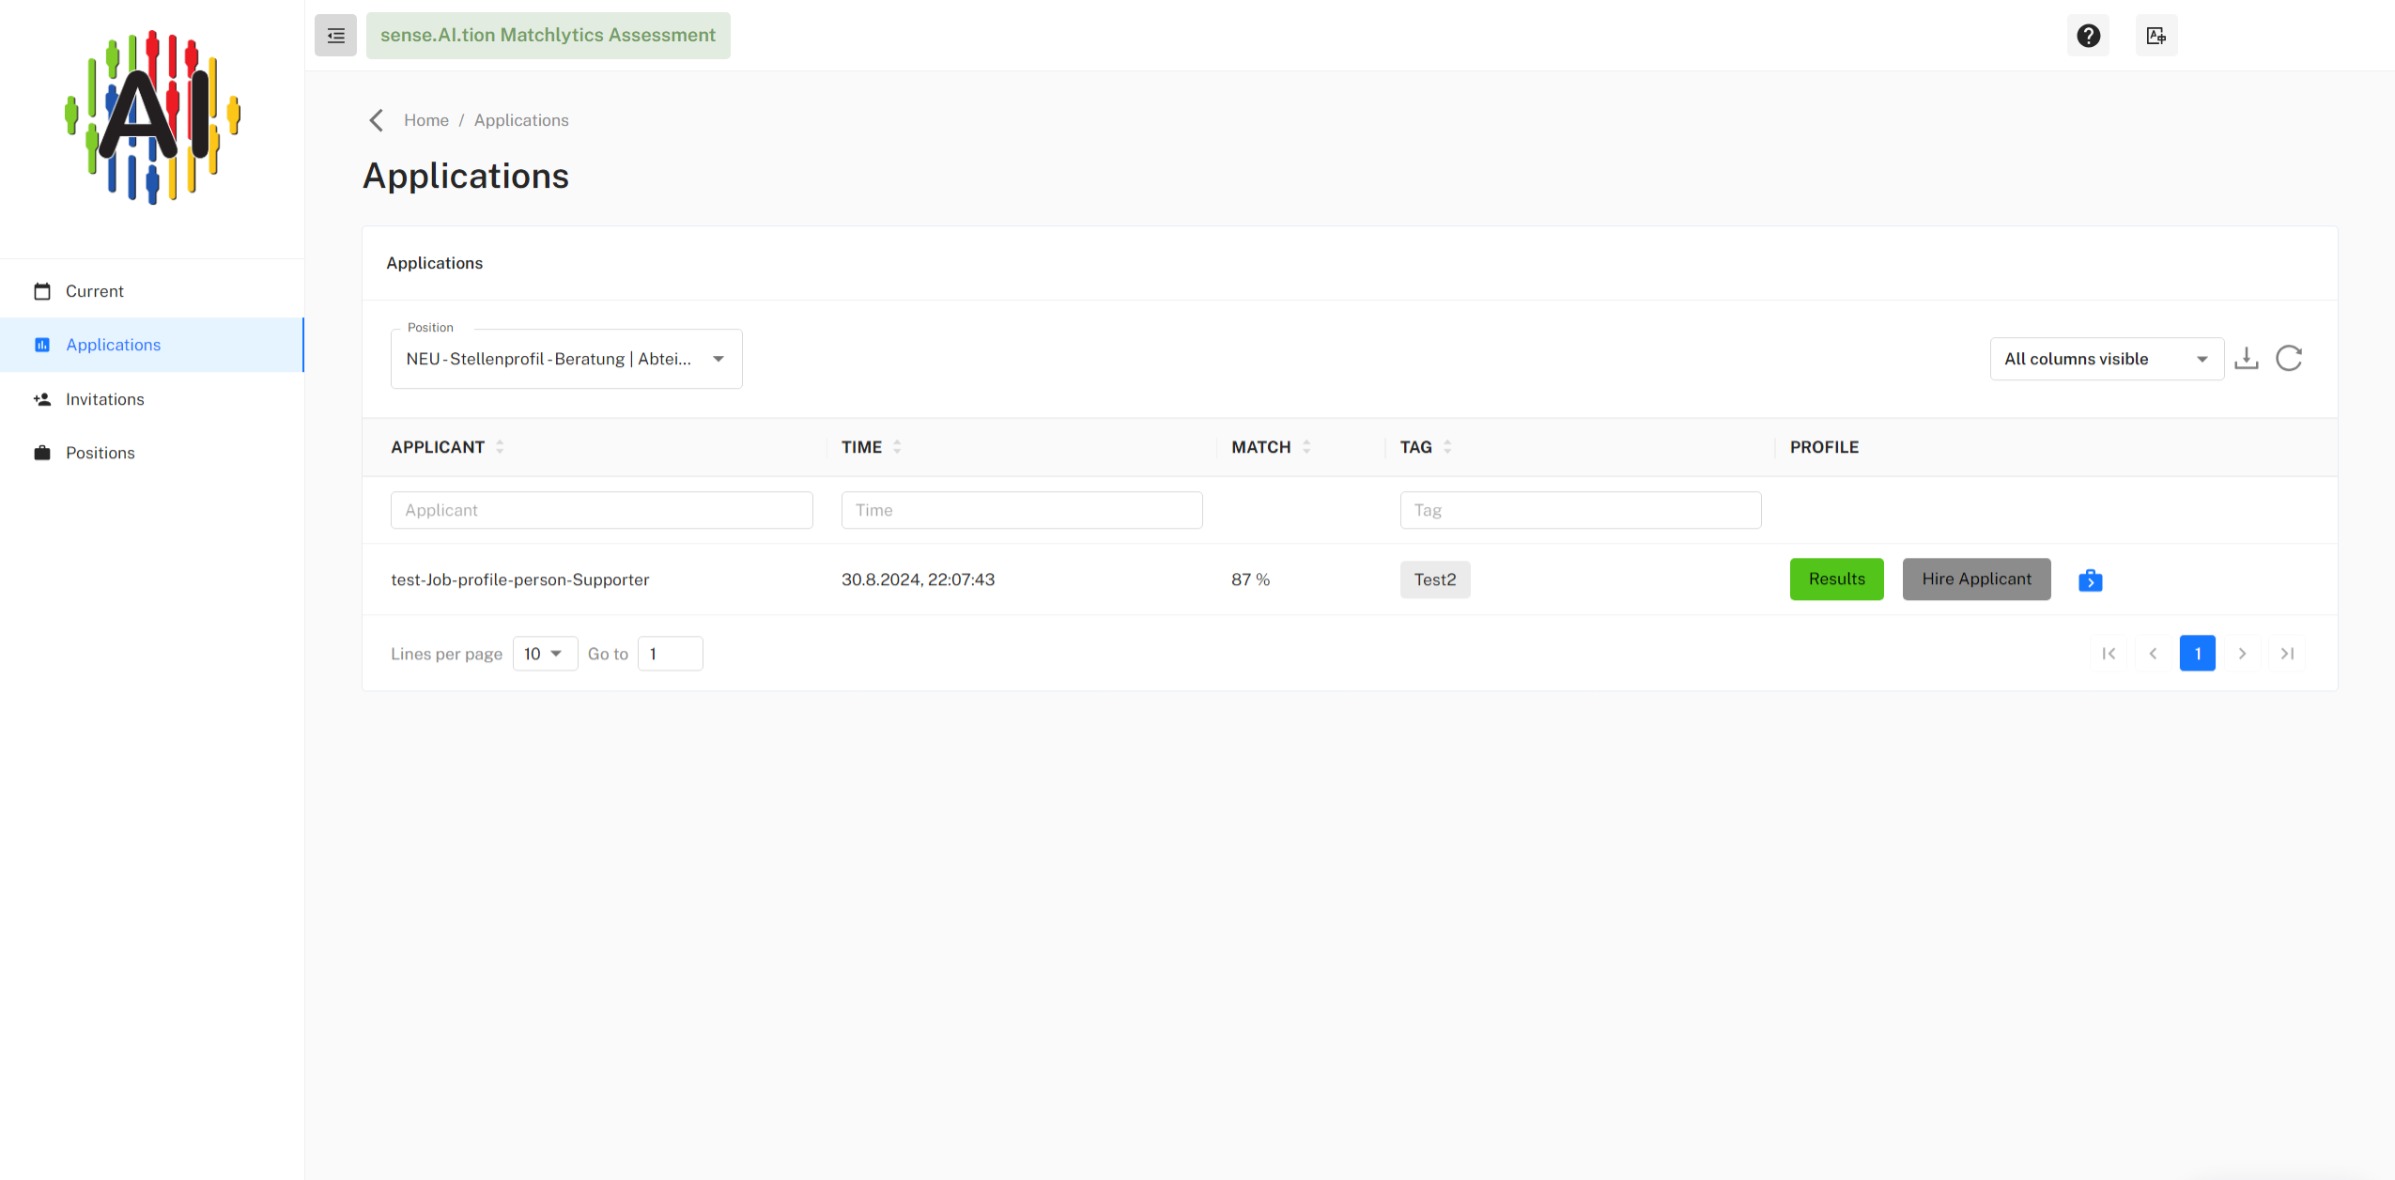
Applications can be viewed via the “Applications” menu. The area displays a sorted list of all available portraits for a selected job posting. The default sorting shows the portraits of the applicants in order of their suitability in percent for the advertised position.
Applicants displayed in this area have followed the link in their invitation and have completed the questionnaire in full. You can view the results for each applicant and thus get a detailed overview of the applicant.
Define filters and columns
The “Show columns” icon can be used to show and hide additional columns in the overview. After the applicant area is called up for the first time, only the “Applicant”, “Incoming”, “Suitability” and “Portrait” columns are displayed. In addition, you can display the individual levels of the results.
The column “Suitability” contains the suitability in percent, according to which the entire table is sorted. Clicking on other column headings will re-sort the table. The “RESULTS” button allows you to view the detailed motivation portrait of individual applicants.

The “Filter” button can be used to filter for applicants. The filters “Applicant” and “Order-Key” are available. Thus, a restriction of the result is possible. The number of profiles displayed can be controlled via the dropdown at the bottom of the table.
Results (motivation portrait)
By clicking on the “RESULTS” button, you will be redirected to an even more detailed view of the respective motivation portrait and can take a closer look at individual values. At this point, you will see diagrams describing the applicant’s suitability in comparison to the job profile. These provide you with information about his suitability.
The applicant portrait and the job template of the job posting are visualized via three diagrams. The purple circle describes the applicant. The yellow diamond shows the requirement of the advertised job. The first diagram shows the classification with regard to the motives “contact”, “power” and “performance”.
The second diagram ranks the applicant’s strengths and the third diagram ranks the applicant’s preferences. You can thus see at a glance how the applicant portrait relates to your job posting.

The “Suitability by TwentyFive” shows the closeness of the applicant (according to his motivational portrait) to the requirements of the job based on the personality levels according to TwentyFive. The buttons next to this diagram open dialogs with diagrams for each of the levels of personality.

In these diagrams, the blue line represents the job template stored in the job posting, while the red line shows the values from the applicant’s motivation portrait. The closer the two lines are, the more suitable the applicant is.
Tab “Suitability”
On the Suitability page, you can see in detail the basic needs and levels at which the applicant deviates from the job template. The closer the applicant (circle) is to the job (diamond), the more suitable he is to perform this job with respect to his personality. In the four diagrams you get an overview that can help you in your decision making.
If there are strong deviations, you will recognize indications of challenges that you can clarify in the job interview/interview. With this information, you can trace a possible development path of the applicant in the company.
Diagram “Motives”
The motives provide information about the applicant’s long-term orientation. A contact motive strives for friendship. Such an applicant focuses more on people than on the task. That is why his tasks should be related to people.
A power person is interested in getting ahead and achieving goals. The fulfillment of a task has the highest priority for him. He likes to support the people who accompany him in this process. He is the perfect program and project manager.
High achievers work best alone or in small teams where they can motivate themselves. They are specialists and usually very good engineers and researchers.
Diagram “Strengths”
The strengths provide information about the applicant’s daily potential. These “activities” come easily to him and he is extremely talented in implementing them.
The strength of development means that the candidate is good at redeveloping old concepts or coming up with new approaches. He is looking for new challenges.
The strength of the consulting means that the candidate has good professional as well as social skills. From a certain distance he can support others.
The strength of motivation means that the applicant with his high social skills likes to accompany other people. Regardless of the task, such people want to move forward together.
The strength of specialization means that the candidate is very good at familiarizing himself with topics. He is a specialist in a subject area. On his own, he provides a qualitative improvement proposal and deals with the subject matter in detail for this purpose.
“Preferences” diagram
This diagram shows the applicant’s preferences in terms of information intake and decision-making. This information helps to know in which departments the applicant is comfortable and can thrive. This information is critical to the learning process and decision making.
A person who rationally absorbs information needs clear communication. Communication should be sober and contain the information that is really at stake. Tasks that contain a lot of details, the person can do well. They prefer numbers, dates and texts to absorb knowledge.
Someone who absorbs information emotionally learns in dialogues and through interpersonal exchange. Information must be linked to feelings in order to be understood. These individuals can learn a lot in conversations and recognize the general mood, which influences their well-being.
A person who makes logical decisions uses structures and tangible information to make comprehensible decisions.
A person who decides intuitively uses his gut feeling. He compares the situation with already existing, own experiences and can make the best-feeling decision for himself.
Chart “Suitability according to TwentyFive”
This chart represents the calculated suitability according to the TwentyFive method on the levels of personality. You can see the detailed result in the Motivation portrait tab.
You can see in percentages on the individual levels of the personality the match with the job template you defined for the advertised position. If you want to see details about the levels, click the buttons next to the diagram. There, the red (applicant) and blue (job) line will show the suitability graphically. The more the lines match, the more the applicant fits the job profile.
Motivations and questions
The third area at the end of the “Aptitude” tab supplements the analyses with hints for an interview/interview.
Tab “MOTIVATION PORTRAIT”
On the page Motivation Portrait the results of the analyzed answers of the questionnaire are presented as the applicant sees them. Here you can see the individual expressions of the applicant in detail and find the links to detailed explanations of the TwentyFive method.
tab “EMPLOYEE PORTRAIT”
On the page of the employee portrait you can see information about the applicant, related to work processes. It describes which activities a person with this personality profile can do easily and well, but also those that become a challenge for him/her. If the applicant is hired as an employee, this information will help to guide and develop the employee.
Tab “EXPORT”
On this page a short profile can be exported as a PDF page. It contains the most important information on a printable DIN A4 sheet. This can be printed and saved for support.
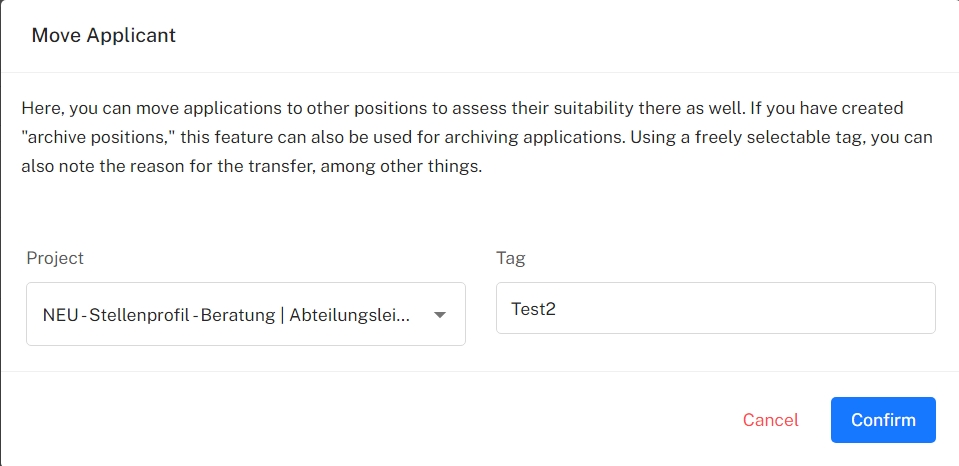
Move Applicant
If you press the blue button with the suitcase symbol next to the “Hire Applicant” button, you will be redirected to another small menu. There you can move applicants to other positions.
In the left selection field you can choose which position the applicant should be moved to. You can also assign any tag to the applicant, for example to note the reason for the move.
Use MatchLytics-Assessment
You can order the product MatchLytics-Assessment (or request a test account) at MatchLytics-Assessment